
Trends in respiratory therapies: why pMDIs hang in the balance of new technology
In May 2023, RDD Europe returned to a real-world conference after years of pandemic-enforced online-only presence. The location was spectacular – Antibes on the Cote d’Azur – with the sparkling Mediterranean Sea providing welcome relief from a dismal British spring.
The industry was well represented by device technology companies, CMOs, academics and pharma companies, and the presentations and workshops provided an engaging blend of research and practical advice.
Even though much of my time over the past ten years has been focused on parenteral device development, my career in combination products started in respiratory devices, working on a variety of dry powder inhaler (DPI) and pressurised metered dose inhaler (pMDI) devices, including the GSK Ellipta inhaler. This year at RDD, as I returned to my roots in this industry, three main themes struck me: preparing for the pMDI cliff edge; moving beyond traditional respiratory diseases; and implementing particle engineering for targeted treatment.
There were also two notable omissions: users and connectivity. More on those later.
Preparing for the cliff edge of pMDI propellants
The shift in pMDIs from using HFC propellants towards gases with a lower global warming potential (GWP) has gained momentum, with California imposing a ban on the sale and distribution of R227ea from the end of 2030, and R134a from the end of 2032, including for medical use. This means the end of the line for the sale of all current pMDI products in California, with other jurisdictions likely to follow suit as the world tries to move to a more sustainable solution.
The transition needs formulators, device designers, scientists, and other disciplines to collaborate to solve the challenges presented by the different physical properties of the new gases. Different thermodynamic and fluid dynamic properties can dramatically alter the plume geometry, droplet size and particle velocity, requiring careful redesign of the fluid pathways to compensate for the differences. These challenges were outlined in evidence presented by Recipharm (1), Proveris and Koura (2), and Healthy Airways LLC (3).
At Cambridge Design Partnership, we are receiving far fewer enquiries for pMDI products than DPIs and soft-mist inhalers. Obviously, an n=1 sample does not have a high degree of certainty, but it reflects a general sentiment among clients to focus future developments away from pMDI platforms.
Moving forward beyond traditional respiratory diseases
Asthma and COPD remain the biggest drivers in device and formulation development, much the same way that diabetes treatment has driven pen injector development. Two drivers that our drug delivery team have seen pushing device design in respiratory and the inhalation market are the need for home treatment, rather than hospital centered treatment; and platforms for biological drugs. The other significant drive is for vaccines that are stable at higher temperatures, which can be delivered without leaving behind copious volumes of blood-contaminated medical waste.
One challenge that comes with these new treatment regimens, beyond formulating drugs that will be stable in powder form, is getting the drug to the correct part of the body and making sure it remains present long enough to be effective. One paper from UCL and the University of Hong Kong (4) highlighted a promising approach to developing therapeutic antibodies against future SARS outbreaks. Some of these developments also require higher dose payloads, or API-only formulations; this presents a substantial challenge to device designers to make sure that the inhalation capabilities of different patient groups can achieve the required dose efficiency.
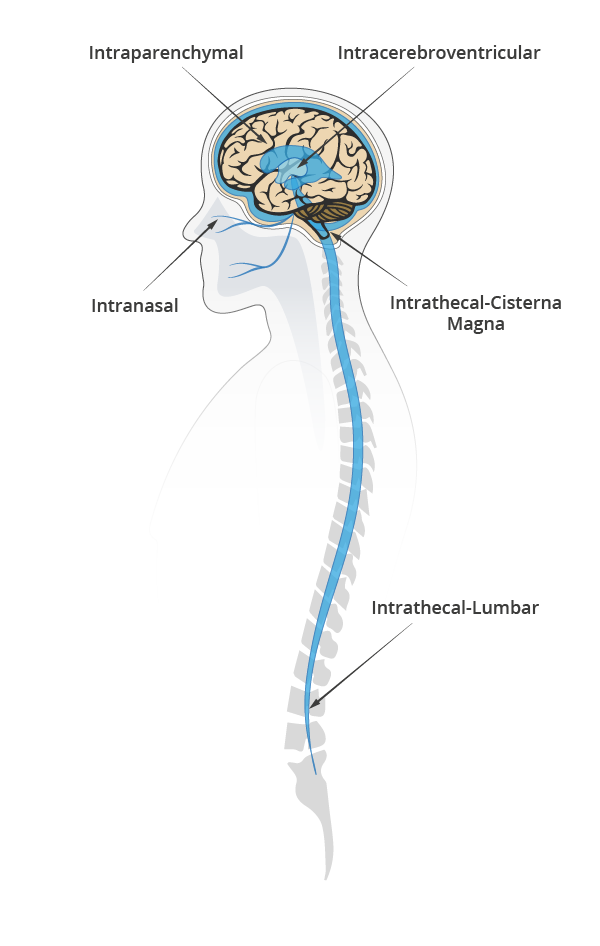
Aptar and Recipharm also shared their own device innovations to present novel spray and softmist technologies based on a syringe primary container. Targeting rapid treatment to the brain via the olfactory route is a much-neglected treatment option, in part due to the challenges of getting consistent behavior with users. At Cambridge Design Partnership, we’ve been working with a pioneering device company looking to exploit this pathway, and my colleague, Clare Beddoes, will be presenting information on this device development at PODD in October.
Enter: particle engineering for targeted treatment
In addition to the paper from UCL (4), particle engineering to target specific areas in the respiratory and nasal pathway was a topic that several posters and presentations addressed directly. Building on standard jet milling techniques, a paper from Aston University explained how isothermal dry particle coating (iDPC) can be used to create more potent formulations without increasing the volume of powder inhaled by the user (5). A third paper from Hovione and two Portuguese institutions focused on the characterization of different particle manufacturing techniques and how they affect deposition in nasal passages (6).
Closing the gap between the early stages of in vitro and in silico models, and the later stage in vivo performance, continues to receive a lot of attention. As the cost of computing power continues to fall, going into clinical or preclinical trials with greater confidence will accelerate time to market and reduce the cost burden on pharma companies looking to novel treatments.
Don’t forget user capability and connectivity
Two areas of development that received relatively little focus at the conference were human factors engineering (HFE) and connectivity – two concerns that are the subject of a great deal of effort in the parenteral sector. Recipharm presented a poster on the HFE advantages of their novel unit dose nasal spray when compared to a reference device (which bore a striking resemblance to an Aptar Unidose Liquid Nasal Spray). Research institution Solvias presented a paper showing how training users can lead to worse outcomes due to misperception of expertise using a device (7). This counterintuitive result demonstrated that patients with limited one-to-one training with a Handihaler showed more errors in use than patients who only had access to the device and IFU.
While these insights were welcome, our in-house team knows that patients continue to struggle to use inhalers reliably and consistently, leaving even the most effective drug products showing variable results.
These challenges for patient use are also being seen in the parenteral market, which is why we are working so closely with our clients to find better ways to train patients and leverage connectivity to improve adherence to medication regimens. These connectivity solutions are often in direct conflict with cost and sustainability targets and finding a route to square this circle is a challenge with which CDP’s designers and engineers are actively engaging.
See you in Tucson?
RDD 2023 was the first RDD conference I have attended. It was great to reconnect with former colleagues and make new connections across the industry. The conference was very well run, and the standard of papers and presentations ensured there was plenty of fascinating material for industry and academia to engage with. I’ve already blocked out my diary for RDD 2024 in Tucson and I look forward to seeing you there.
References
-
-
- Albuterol Sulfate Metered Dose Inhaler Feasibility Using an Environment Friendly Propellant HFA152a and Novel Valves (Lei Mao, Sheryl Johnson, Nischal Pant, James Murray, Donald Ellis, Benjamin Zechinati, Johnathan Carr and Victoria Cruttenden)
-
- Comparison of Spray Characteristics of P-134a and Low GWP P-152a pMDIs With and Without Ethanol (Lynn Jordan, Sheryl Johnson, Ramesh Chand, Grant Thurston, Deborah Jones, Vanessa Webster and Sally Stanford)
-
- Accelerated Development of MDIs with Low GWP Propellants in a QbD Era: Practical, Regulatory and Scientific Considerations (Healthy Airways LLC and First Flight Pharma LLC)
-
- Inhaled Antibody Therapies: Enabling Prophylactic Protection against SARS-CoV-2 Infection with a Dual Targeting Powder Formulation (Han Song Saw and Jenny Ka-Wing Lam)
-
- Use of Isothermal Dry Particle Coating (iDPC) for the Development of High Dose Dry Powder Inhalers (Jasdip S. Koner, David A. Wyatt, Amandip S. Gill, Shital Lungare, Rhys Jones and Afzal R. Mohammed)
-
- Benchmarking of Particle Engineering Strategies for Nasal Powder Delivery: Characterization of Nasal Deposition Using the Alberta Idealized Nasal Inlet (Patricia Henriques, Cláudia Costa, António Serôdio, Ana Fortuna, and Slavomíra Doktorovová)
-
- Effect of Capsule-Based Dry Powder Inhaler User Training on In Vitro Performance (Oleksandra Troshyna and Yannick Baschung)
-
Connect with CDP
For more on how to navigate the evolving respiratory device landscape, from propellant transitions to targeted delivery, contact Cambridge Design Partnership.